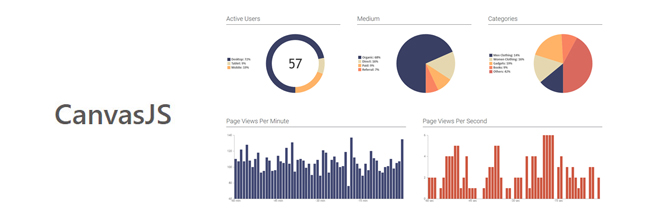
JavaScript library for creating graphs and charts on Unipos website CanvasJS Page has been added.
CanvasJS Is a JavaScript library for creating graphs and charts on websites and applications. You can create 30 types of charts including line charts, bar charts, pie charts and funnel charts, and display them on iPhone, iPad, Android, Mac and other PCs. Supported by Chrome, Firefox, Safari, IE (8 and above) browsers. Since it is compatible with all browsers and devices, you can create high-quality dashboards without compromising the maintainability and functionality of web applications.
CanvasJS has SaaS / OEM License andInternal Apps There are two types of licenses.
SaaS / OEM license:
License applied when building a SaaS project or incorporating CanvasJS in your product (whether hardware or software)
Internal Apps license:
License applied when using CanvasJS only in-house
For a list of available chart types, see the manufacturer page.
Charts Gallery
|
■ Click here for product details and inquiries |


