
For real-time chart applications handled by Unipos "SciChartI received an inquiry.
SciChart Developed with an emphasis on speed and performance, it can smoothly create 2D/3D real-time charts for big data of millions to billions.
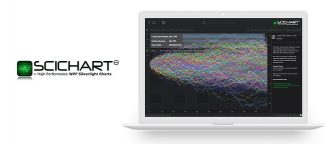
What is SciChart?
![]()
![]()
SciChart is highly rated by thousands of developers in over 40 countries around the world.
Libraries for 2D/3D real-time charting applications designed to be the fastest possible for demanding scientific, engineering, trading and financial applications.
Through SciChart's platform (WPF, iOS, Android, Xamarin), millions of data points can be visualized in real time as high performance charts.
Major features
- High-speed and high-performance chart creation is possible even for big data
- Perfect for financial, trading, scientific and medical applications
- Fastest WPF chart
- For WPF, iOS, Android and Xamarin applications
- Strong technical support with technical expertise
- rich charts
Line, Scatter, Bubble, Column, Candlestick/OHLC, Mountain, Area, Band, Pie, Heatmap, Stacked Column, Stacked Mountain, Pie, Donut, 3D Bubble Chart, 3D Surface Mesh Chart, etc.
Field of utilization
Pharmaceuticals, Oil & Gas, Medical Device Manufacturers, Instrumentation, Defense, Aerospace, Motorsports, Process Automation, Mining, Investment Banking, Trade, etc.
Line up
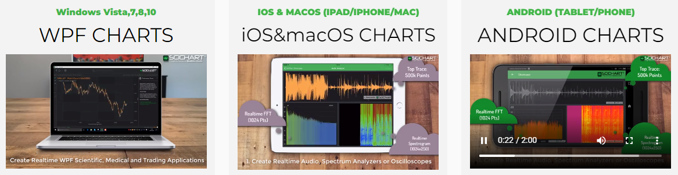
In addition to bundled products that are useful for development, we have a lineup of stand-alone products (WPF CHARTS (2D), WPF 3D CHARTS, iOS CHARTS, Android CHARTS, Xamarin Chart) by platform.
Please select according to your application.
bundle product
- SciChart Bundle 2D Professional : License for 2D charts
- SciChart Bundle SDK Professional : License including both 2D & 3D charts
- SciChart Bundle SDK Enterprise : License including 2D & 3D charts plus source code
Single product
- WPF version: SciChart WPF 2D Pro, SciChart WPF SDK (2D/3D) Pro
- iOS version: SciChart iOS 2D Pro, SciChart iOS SDK (2D/3D) Pro
- Android version: SciChart Android 2D Pro, SciChart Android SDK (2D/3D) Pro
- macOS version: SciChart macOS 2D Pro, SciChart macOS SDK (2D/3D) Pro
- JavaScript version: SciChart JS 2D Pro, SciChart JS SDK (2D/3D) Pro
Introducing the next generation JavaScript chart SciChart JS from the lineup
SciChart.js uses the real-time capabilities of WebGL and WebAssembly to create fast, dynamic and interactive JavaScript charts.
It has amazing flexibility and rich features (over 40 2D and 3D chart examples).
Main functions
- Supports multiple chart animations
- Chart Modifier API: Rich Cursors and Tooltips
- ChartModifier API: pan and zoom effects
- Annotations API: annotations and markers
- Theme Manager: styling and themes and more
- Scaling flexibility: unlimited, multiple X and Y axes
- Rich axis types: numeric axis, category axis (stock chart axis), logarithmic axis, etc.
- Impulse chart or horizontal vertical error bar chart
- Financial Stock Charts: Candlesticks/OHLC etc.
*Please refer to the manufacturer's website for product details.
JavaScript Chart Library
https://www.scichart.com/javascript-chart/
Javascript demo
SciChart.js includes over 80 JavaScript chart demos, available for viewing, source code and related documentation. SciChart.js is a high-performance JavaScript charting library, very useful for building complex dashboards.
For how to create a simple chart using the functions (API) of SciChart.js, please refer to the demo list on the manufacturer's site.
JavaScript Chart Examples
https://demo.scichart.com/
About License
SciChart is a perpetual license. One year of update support is included as standard (extension of support period is also possible).
One license is required for each developer.
Please feel free to contact us regarding Site License and Academic License.
Try SciChart: About the Trial Version

SciChart is free to try the latest features for 30 days. Download the SDK for the SciChart charting library, as well as access technical support and forums.
SciChart's Please apply from the manufacturer page.
|
■ Click here for product details and inquiries SciChart | Library for real-time chart applications
|