
2D/3Dでのデータ可視化のための Windows Forms および WPF用 ソフトウェア開発キット LightningChart の最新版 v8 が2017年3月7日にリリースされました。
LightningChart は、科学、工学、医学、航空宇宙、貿易、エネルギーなどの分野に適した、数多くの種類のチャートコンポーネントを含んでおり、10億データポイント以上のデータをリアルタイムで表示する高い描画処理能力を持っています。
v8 からの新機能として、チャートライブラリの3Dオブジェクトと関連づけ可能なVolume Rendering 機能が追加されました。体積測定情報を利用する医学分野や、CTや超音波による非破壊検査などにおける活用が想定されています。
【Lightning Chart 各機能の特徴】
XY Charts
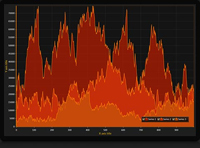
Series types: sampled data (discrete signal), point-line, freeform point-line, areas, high-low, polygon, stock (candle-stick), bar, band, constant line, intensity grid, intensity mesh
3D charts
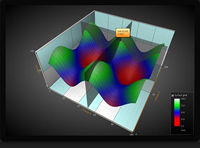
Series types: surface mesh, surface grid, waterfall, polygon, rectangle planes, mesh models, point-line, bar and pie charts
Maps
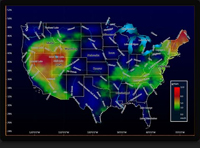
On-line tile maps: supports street maps and satellite imagery
Dozens of maps: World, continents, specific areas
Multi-layer: land, lakes, rivers, roads, cities etc
Smith view
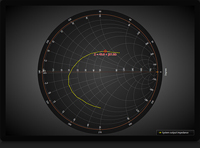
Series types: point-line
Polar View
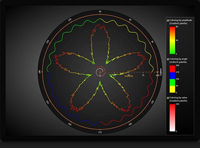
Series types: area, point-line
Volume Rendering
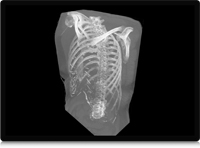
・Separate Linear Transfer function for every channel
・Volume Thresholding in accordance with voxels brightness for every channel
・Dynamic modification of Voxel range
・Manual or Automatic Adoptive sampling rate of volume data
・Three interchangeable options for Volume Rendering Ray function
・Full interaction with traditional 3D models
Signal Tools
…SignalReader
…AudioInput
…SignalGenerator
…SpectrumCalculator
…AudioOutput
| ■商品の詳細、お問い合わせはこちら LightningChart | データ可視化のためのソフトウェア メーカー (Arction Ltd.) WEBサイト |