

Thankfully, our storage server is operated by various customers, but it seems that the failure rate of the hard disk drive (HDD) is higher than others due to the installation environment and usage conditions. There is also an environment. Therefore, I tried to summarize the increasing trend of SMART value and the replacement status of HDDs that were delivered at the same time and used at three sites that have maintenance contracts over three years of operation. We understand that we will do it.)
When operating a storage system, I would like to use it as a reference for how much maintenance disks and costs should be looked at.
Storage server 1Configuration per unit
| Hard disk used | Seagate Constellation ES 7200rpm 32MB Nearline HDD (* Note 1) C drive x 1 unit, data drive x 11 units * All used disks have been screened (selection test). |
| Case | Supermicro SC826TQ-R800LPB (2U rack mount) |
* Note 1: Nearline means the middle of “online” storage for servers that are frequently accessed and rewritten and “archive” for long-term storage of data. Nearline HDD is for general desktop The design emphasizes reliability more than HDD.
Usage environment
-The server room temperature is stable at around 26 ° C.
・ All HDDs of the same series are used.
-Access to each HDD is random and operates 24 hours a day, 365 days a year.
-The operation monitoring period is about three years from March 2011 to March 3.
Status of each monitored base
| Constitution | Load on each disk | |
| Location A | 12 HDDs x 12 servers | There is an average of 2G-4GB read / write and deletion every day. |
| Location B | 12 HDDs x 4 servers | Read / write about 0.6GB on average every day, only basic addition |
| Location C | 7 HDDs x 4 servers | Read / write about 0.2GB on average every day, only basic addition |
Disk replacement status
It is a history of HDD replacement support for about 2011 years from 3/2014 to 3/3.
| Site A (144 out of 16 units exchanged) | Case | Exchange history |
| Storage 1 | Exchange 4 disks | |
| Storage 2 | No replacement | |
| Storage 3 | No replacement | |
| Storage 4 | Exchange 2 disks | |
| Storage 5 | Exchange 4 disks | |
| Storage 6 | Exchange 1 disks | |
| Storage 7 | Exchange 1 disks | |
| Storage 8 | No replacement | |
| Storage 9 | Exchange 1 disks | |
| Storage 10 | Exchange 1 disks | |
| Storage 11 | Exchange 1 disks | |
| Storage 12 | Exchange 1 disks |
| Site B (48 out of 1 units replaced) | Case | Exchange history |
| Storage 1 | No replacement | |
| Storage 2 | No replacement | |
| Storage 3 | No replacement | |
| Storage 4 | Exchange 1 disks |
| Location C (out of 28 units, no replacement) | Case | Exchange history |
| Storage 1 | Exchange 4 disks | |
| Storage 2 | No replacement | |
| Storage 3 | No replacement | |
| Storage 4 | Exchange 2 disks |
The replacement history above does not include complete failures, but includes preventative replacements with increased probability of failure (see below). The MTBF (Mean Time Between Failures) of the HDDs used is 140 million hours = 159.7 years, so a simple calculation shows that if 100 HDDs were used for 24 hours a day, 365 days a year, it would be 1 in a year. It means that the machine breaks down. Based on that number, you can expect 0.626 storages (12 HDDs) to fail about 144 in 3 years.
Since there is a difference in the amount of data handled, the amount of read / write, and the number of units, it is not possible to make a general comparison, but considering the MTBF value, the exchange rate at site A is higher than expected. It seems that the failure rate depends on the usage and environment. Many HDDs are replaced proactively when a warning sign appears, and only three HDDs were replaced after the actual failure level (not recognized) was reached.
SMART value fluctuation of failed / replaced disk ... “Reallocated Sector Ct”
For the disks that were replaced, the SMART value "5 Reallocated_Sector_Ct (replacement-processed bad sector)" was fluctuated. Below, we graphed the transition of the number of sectors that have undergone alternative processing and the cases in which they were replaced due to a failure, the cases in which they were replaced proactively before the failure, and the number of sectors processed for replacement. Other than this value, no SMART value movement that could affect failure prediction was observed during the monitoring period.
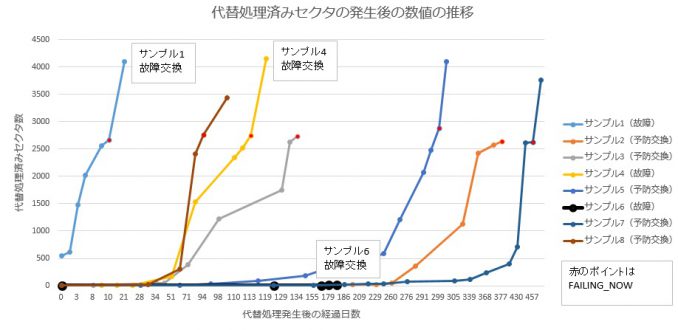
About FAILING_NOW
Normally, SMART values are displayed as shown below, but when the Normalized value displayed under the "VALUE" heading falls below the threshold value, "WHEN_FAILED" is displayed. "FAILING_NOW" is displayed under the heading. If "FALING_NOW" is displayed, it means that the status is below the threshold and is dangerous.
Discussion and supplement
Since the absolute number of data is small to draw a conclusion, it is only a consideration of the phenomenon in front of us, but at present, the following can be considered.
◆ The curves of the numerical change of “5 Reallocated_Sector_Ct” of the disks reaching FAILING_NOW are similar. If the number increases sharply over the course of a month (more than a few hundreds are recorded), then it is likely that it will fall below the threshold and reach a failure within the next few months to half a year. Conceivable.
◆ The HDD that has become unrecognizable stops recognizing about 1 week after FAILING_NOW occurs.
◆ There is a case where it suddenly fails regardless of the SMART value as in sample 6.
◆ Differences due to environment and frequency of use
In addition to the fact that there is a difference in the frequency of reading and writing data in the first place, in the A environment, we always use an inverter type UPS, but the land pattern, voltage fluctuations are severe, and planned power outages are frequently performed, so the power supply ON / OFF is frequently generated. I can't say for sure if this is a direct stress on the HDD, but it is one of the differences from the B and C environments. The server is designed for constant availability and is considered a less desirable environment.
◆ Variation in quality of HDDs and other parts
There may be differences due to manufacturing lots, because the delivery times of bases A, B and C are slightly different. In addition, during the measurement period from March 2011 to March 3, most of the disks were replaced in 2014. For disks that survived that period (?) And disks after replacement, no significant increase in alternative sectors has been observed so far.
◆ This time, we are using nearline HDD, but I would like to summarize in the future how it compares with HDD and SSD for consumer and special purpose.
Afterword
Experience has shown that FAILING_NOW occurs on average for about one week after that, and then becomes unrecognizable. Also, regarding the alternative sector, even if it gradually increases and the total number exceeds 1, it may take a considerable time to reach the level of not recognizing (in a sense, normally I think that you can also think that it is operating normally because the allocation is successful). We use the data around this as one of the references for the exchange time.
In the operation of the above server, preventive replacement will be implemented if the number of alternative sectors increases too quickly or if FAILING_NOW occurs. However, even if there is no abnormality in the SMART value, it is possible to suddenly stop recognizing, or something suspicious of the operation, so it is also a good idea to overtrust the SMART value.
I think that the SMART value should be used as a reference only in consideration of how critical a disk failure is to a problem in operation, and to prepare for a failure before it. I will. We believe that if we can establish a standard for countermeasures against changes in SMART values and operate it, unnecessary troubles can be reduced.