

Software development kit for Windows Forms and WPF for data visualization in 2D / 3D Lightning Chart The latest version of v8 was released on March 2017, 3.
Lightning Chart Includes a large number of chart components suitable for fields such as science, engineering, medicine, aerospace, trade, energy, etc., and has high drawing processing power to display over 10 billion data points in real time. I am.
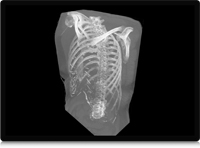
New from v8, can be associated with 3D objects in chart librariesVolume rendering Features have been added. It is expected to be used in the medical field that uses volumetric measurement information, and in non-destructive inspection using CT and ultrasonic waves.
[Features of each Lightning Chart function]
XY Charts
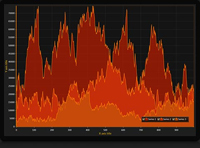
Series types: sampled data (discrete signal), point-line, freeform point-line, areas, high-low, polygon, stock (candle-stick), bar, band, constant line, intensity grid, intensity mesh
3D charts
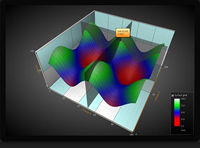
Series types: surface mesh, surface grid, waterfall, polygon, rectangle planes, mesh models, point-line, bar and pie charts
Maps
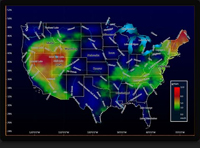
On-line tile maps: supports street maps and satellite imagery
Dozens of maps: World, continents, specific areas
Multi-layer: land, lakes, rivers, roads, cities etc.
Smith view
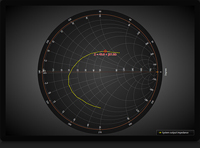
Series types: point-line
Polar View
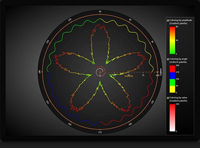
Series types: area, point-line
Volume rendering
・ Separate Linear Transfer function for every channel
・ Volume Thresholding in accordance with voxels brightness for every channel
・ Dynamic modification of Voxel range
・ Manual or Automatic Adoptive sampling rate of volume data
・ Three interchangeable options for Volume Rendering Ray function
・ Full interaction with traditional 3D models
Signal Tools
… Signal Reader
… Audio Input
… Signal Generator
… Spectrum Calculator
… Audio Output
| ■ Click here for product details and inquiries LightningChart | Software for data visualization Manufacturer (Arction Ltd.) Website |